How does the distance between teams affect the outcome?
November 19, 2024
In summary, as the distance between soccer teams increases, the likelihood of a home team victory and a draw both rise, while the probability of an away team victory decreases.

| Distance (km) | Matches | Home | Draw | Away |
|---|---|---|---|---|
| 1-50 | 6680 | 0.4367 | 0.2497 | 0.3136 |
| 51-150 | 18849 | 0.4290 | 0.2581 | 0.3129 |
| 151-250 | 15979 | 0.4316 | 0.2667 | 0.3018 |
| 251-350 | 13295 | 0.4448 | 0.2676 | 0.2876 |
| 351-450 | 7696 | 0.4443 | 0.2723 | 0.2834 |
| 451-550 | 6152 | 0.4517 | 0.2698 | 0.2784 |
| 551-750 | 6660 | 0.4432 | 0.2785 | 0.2782 |
| 751-1150 | 4328 | 0.4508 | 0.2745 | 0.2747 |
| 1151-2500 | 1662 | 0.4663 | 0.2864 | 0.2473 |
How Does Distance Affect Goal Counts?
As the distance between teams increases, the total number of goals scored in a match decreases. The graph below clearly illustrates how the probability of fewer than 2.5 goals being scored rises with greater distances.
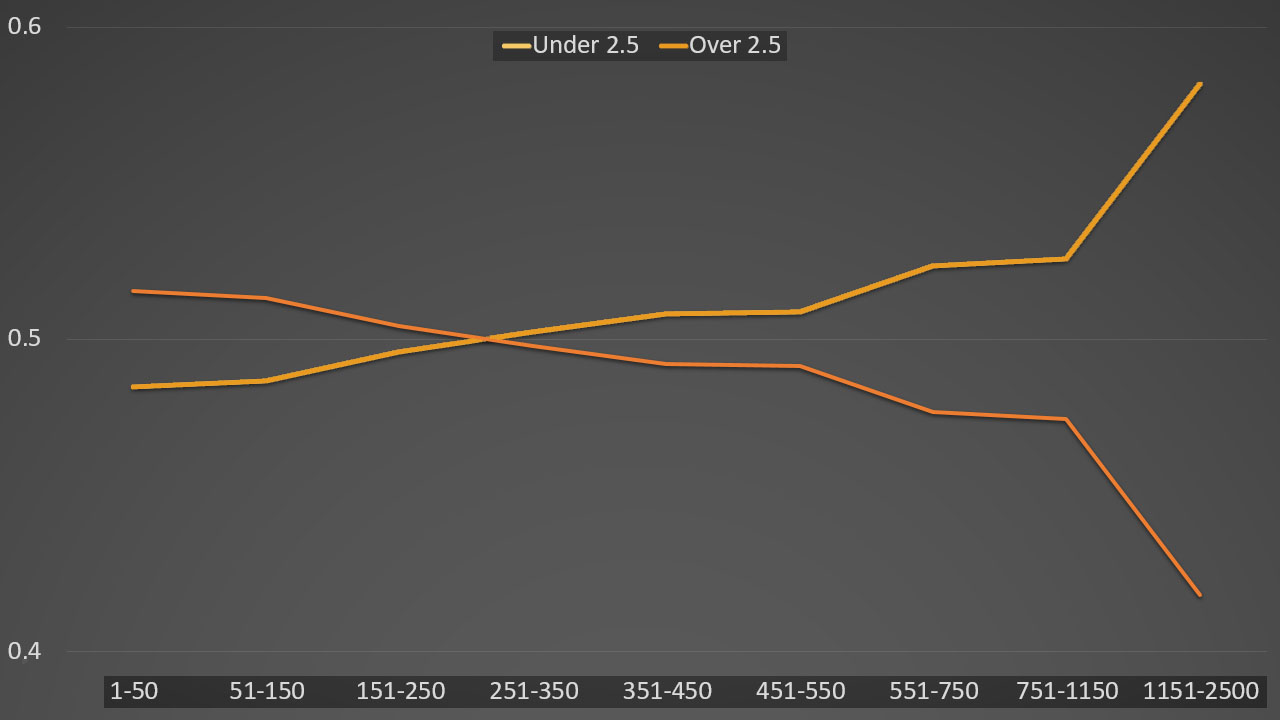
| Distance (km) | Matches | Under 2.5 | Over 2.5 | Home goals | Away goals | Total goals |
|---|---|---|---|---|---|---|
| 1-50 | 6680 | 0.4846 | 0.5154 | 1.507 | 1.213 | 2.721 |
| 51-150 | 18849 | 0.4867 | 0.5133 | 1.496 | 1.23 | 2.727 |
| 151-250 | 15979 | 0.4958 | 0.5042 | 1.49 | 1.198 | 2.688 |
| 251-350 | 13295 | 0.5023 | 0.4977 | 1.5 | 1.158 | 2.658 |
| 351-450 | 7696 | 0.5081 | 0.4919 | 1.481 | 1.135 | 2.615 |
| 451-550 | 6152 | 0.5086 | 0.4914 | 1.503 | 1.147 | 2.65 |
| 551-750 | 6660 | 0.5234 | 0.4766 | 1.458 | 1.119 | 2.577 |
| 751-1150 | 4328 | 0.5257 | 0.4744 | 1.465 | 1.118 | 2.583 |
| 1151-2500 | 1662 | 0.5818 | 0.4182 | 1.409 | 0.985 | 2.394 |
Recent Posts
November 19, 2024
How does the distance between teams affect the outcome?
An analysis of how the distance between soccer teams impacts goal counts and match outcomes.
Read MoreNovember 8, 2024
How many passes are made in a football match?
A look at the pass counts in European football leagues over the past three seasons.
Read MoreNovember 1, 2024
The Most Common Results in Football Matches
An analysis of the most common football match results in European leagues, revealing trends in scorelines and outcomes.
Read More